 What reports do you use to manage your firm’s sales effort… Year-to-date sales? Sales by service line? Sales by industry? If you had to pick just one report by which to manage your sales efforts, what would it be? What about to manage your own sales efforts?
In both cases, the answer is the same – the ‘sales pipeline report.’ Created and used properly, it’s the one tool that can keep your sales efforts on track, ensure that nothing falls through the cracks, tells you what next steps are with every sales prospect and provides senior management with nearly everything they need to know.
It’s funny… for the last 13+ years, I’ve asked virtually every client we’ve worked with if they use a pipeline and they’ve all said “yes.” But when I asked for a copy of it, what I get instead is a ‘conversion report.’ That is, how many bids are out and how many they’ve won.
And while that’s important, that’s not a pipeline. That’s the bottom of the pipeline! And at that point in the buy-sell process, there’s really nothing you can do to impact the outcome.
Overview
At its core, a pipeline tracks and provides details on all opportunities at every stage of the buy-sell process: e.g. lead – initial call – deeper conversations – capabilities presentation – RFP – win/lose. The idea is to continually be adding names to the top and working with them through the different stages to the ultimate outcome: win or not. Here’s an example in spreadsheet form…
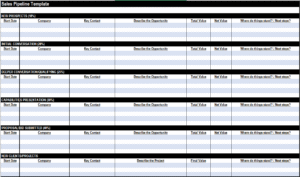
And here’s the key… within those stages are lots of opportunities to effectively measure, plan and better understand your sales efforts.
Inside the Pipeline
The pipeline report provides constantly updated (if your sales team is doing its job) information to keep you apprised of what’s going on, as well as a variety of metrics to help you understand what’s going on. For example…
Value
The pipeline is an ‘always on’ forecasting tool. With some simple calculations, you can create an accurate ‘overall revenue forecast’ (something senior management loves!).
While these revenue estimates are based on historical data, once you determine that history, the forecast will end up being pretty accurate. It works like this…
Step 1: Based on your history, assign a probability of a prospect in each stage of the pipeline actually becoming a client. For example, you might learn that ‘10% of all new leads you put in the pipeline will eventually become a client’ or that ‘30% of every prospect who sees a capabilities presentation will become a client.’ If you’ve been properly using a pipeline for a while, you can figure that out.
Step 2: What is the dollar opportunity for each prospect/project in the pipeline?
Step 3: For each opportunity in each stage, multiply the dollar opportunity by that stage’s probability to determine the net opportunity. For example, if 10% of new leads in the pipeline eventually go on to become a client, and a particular opportunity in that stage is $60,000, then the net potential is $6,000.
Step 4: Then add up all of the net opportunities in the entire pipeline… and that’s your current forecast. The good news? This forecast is constantly refined as your sales reps update the pipeline with new information.
Velocity
That is, the average amount of time a prospect spends in one stage before moving on to the next one. Not only can you track that for each stage, but add them all together and you can determine your actual ‘sales cycle.’ That is, what’s the average time for a new lead to become a new client? An important metric.
Conversion
Similarly, conversion tracks the percentage of opportunities that move from one stage to the next. As mentioned earlier, most agency leaders are only concerned with the final conversion – bids versus wins. But the conversion from one stage to the next is also critical.
Imagine you have three seller-doers on your team. Two of them have a conversion rate for ‘capability presentation to RFP’ of about 40%. But the third rep is at about 20%. This tells you that rep 3 might not have the presentation skills that reps 1 and 2 have. Here’s your opportunity to coach and train rep 3 so that he/she gets better. Without these metrics, you might come to the premature conclusion that rep 3 should be fired.
Further, when you combine the conversion rate with the velocity, you begin to get a deeper understanding of your firm selling process and how your reps are executing within it.
Conclusion
While I think that traditional sales reports are important and provide valuable information, they only provide data after the fact. That is, ‘trailing indicators.’ The pipeline report provides insights before and as things are happening – ‘leading indicators’ – allowing you to react, step in and make the necessary changes to improve your sales team’s outcome. Not bad, huh?
If implementing a full pipeline reporting system is not part of your sales management efforts, it needs to be. It’s not difficult to do… you just need to start!
Good luck and good selling.
By the way, if you’d like a copy of the Pipeline Template shown above, Click Here for a free download.